The Inspirational Story of Alleco’s Founding Partner, The Woman Who Founded The Law Firm To Help Indonesian MSMEs Succeed
March 11, 2022
Sharing Session: UCSI University Postgraduate Programs
March 14, 2022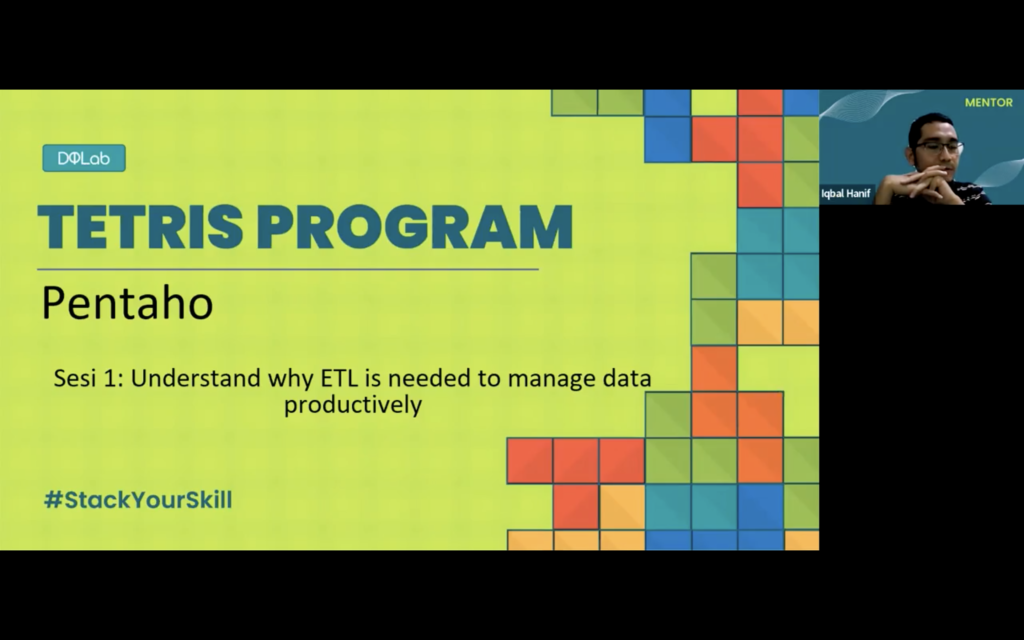
(dok.DQLab)
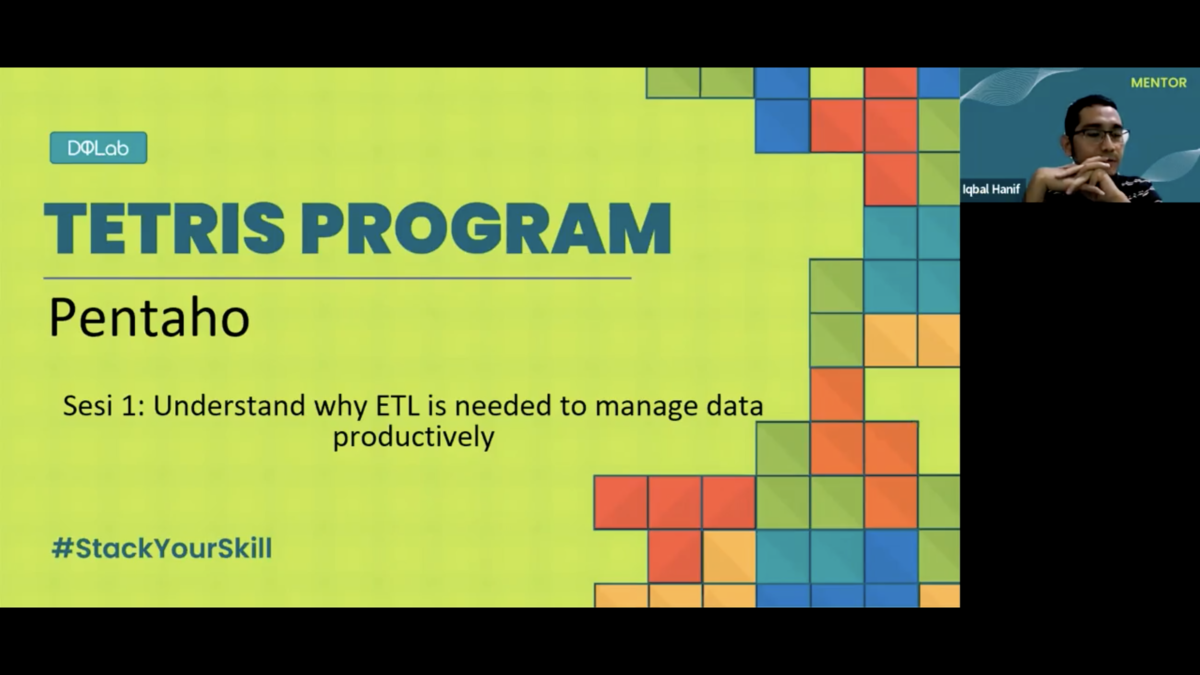
TANGERANG – DQLab conducted their first session of the Tetris Program virtually on Thursday (03/03/22). DQLab invited speaker Iqbal Hanif, a Big Data Analytics at Telkom Indonesia, to discuss why ETL (Extract Transform Load) is needed to manage data productively.
As reported before, Tetris Program is a program by DQLab that offers participants to learn data science intensively and have the opportunity to partake in an internship and build a career.
Opening this session, Iqbal explained that big data is the largest contributor to data analytics. He said that big data enables companies to collect as much data as possible, pushing companies to sort their data effectively. Iqbal also mentioned the 5V’s of big data: volume, velocity, variety, veracity, and value. In its process, big data will be processed into a dashboard. The process is called ‘data engineering,’ with ETL as one of its components.
Iqbal continued explaining the meaning of ETL. The ‘E’ stands for ‘Extract’, an extraction process from various data sources like databases, websites, applications, files, APIs, sensors, etc. The ‘T’ stands for ‘Transform’, which filters, processes, and combines relevant data, making it clean and high quality. There are various types of transforming: casting/changing data type, calculating, aggregating, selecting column/attribute, splitting, merging, standardizing/cleansing, joining/lookup, etc. The ‘L’ stands for ‘Load’, which sends the final data ready to use to a database (warehouse (data lake) and data mart).
“The extraction process is not simple. Because of the variety of data, it requires different types of approaches,” Iqbal said.
Before touching on the importance of ETL, Iqbal first discusses about Online Transaction Processing (OLTP) and Online Analytical Processing (OLAP). OLTP focuses on transactions, while OLAP focuses on analyzing data with huge volumes. OLTP has characteristics like relying on transactions, quick processing, numerous tables with small sizes, and not requiring much time and normalization. During the session, he gave examples of normalization and denormalization tables.
Also read Tips and Tricks of Learning Data Science for Non-IT Beginners
This session also touched on analytics architecture. Quoting sisense, analytics architecture refers to the systems, protocols, and technology used to collect, store, and analyze data.
Iqbal explained how ETL plays a part in analytics architecture. He explained that it starts from the ETL data that covers customers, inventories, credits, sales, operations, and externals. Then all of that is combined and stored in the data warehouse. The data warehouse will be separated accordingly (data mart, finance data mart, and distributor data mart).y Business Intelligence (BI) and OLAP then process the data mart to produce reports that stakeholders easily understand.
The data warehouse is a database that consists of integrations from all the data sources in an organization or company so that all reports are taken from there. There are a few characteristics of a data warehouse: Numerous data, numerous subjects, massive in size (>100GB), implementation time requires months even years. In comparison, a data mart is a subset from the data warehouse to support a unit’s analysis or reporting and a part or operation in a company. Its characteristics are the opposite of data warehouse, such as minimal data, single subject, small-sized data (<100GB), and the implementation time only requires a few months.
In the process of OLAP, ELT plays a part in extracting data to avoid disturbing the operational process, collecting data historically in the data warehouse, correcting the data quality to optimize the OLAP.
“ETL is important to extract data and change it into data usable by Data Scientists or Data Analysts,” Iqbal said.
There are three kinds of data: structured, semi-structured, and unstructured. Here are the differences between the three:
- Structured data: it has a tabular format, easy to be understood by humans, rigid, applied in several systems like customer relationship management (CRM) and enterprise resource planning (ESP).
- Semi-structured data: contains key and value, structured but not rigid, a format not easy to be understood, applied in application developments and API.
- Unstructured data: has a lot of formats like text, files, images, videos, and emails. It also has a specific method when extracting data.
Iqbal then explained the tools used in data processing. He divided the tools into two: graphical user interface (GUI) and command-line interface (CUI). In the GUI, there are Pentaho, Talend, Azure Data Factory, SQL Server, etc. While CUI includes Python, R, SQL, PHP, Scala, etc.
“GUI tools are easy to use and easy to interpret but are relatively slow, and some features are not free. While CUI, the tools have the advantage of being faster and open-sourced, but you may have to learn programming languages or learn to code and are difficult to interpret,” Iqbal said.
Closing this #1 session and preparing for the next session, Iqbal provided the participants with a Pentaho installation guide for Windows and MacOS.
Through the Tetris Program, DQLab prepares participants before starting a career in the actual data industry by providing scholarship and internship opportunities. There are other DQLab programs that you can join, which can be accessed at their official site DQLab.id.
*by Lathifa Lisa | DQLab
Kuliah di Jakarta untuk jurusan program studi Informatika| Sistem Informasi | Teknik Komputer | Teknik Elektro | Teknik Fisika | Akuntansi | Manajemen| Komunikasi Strategis | Jurnalistik | Desain Komunikasi Visual | Film dan Animasi | Arsitektur | D3 Perhotelan | International Program, di Universitas Multimedia Nusantara. www.umn.ac.id
