NON-IT students, Let’s Learn Data Quality for Accurate Data!
April 20, 2022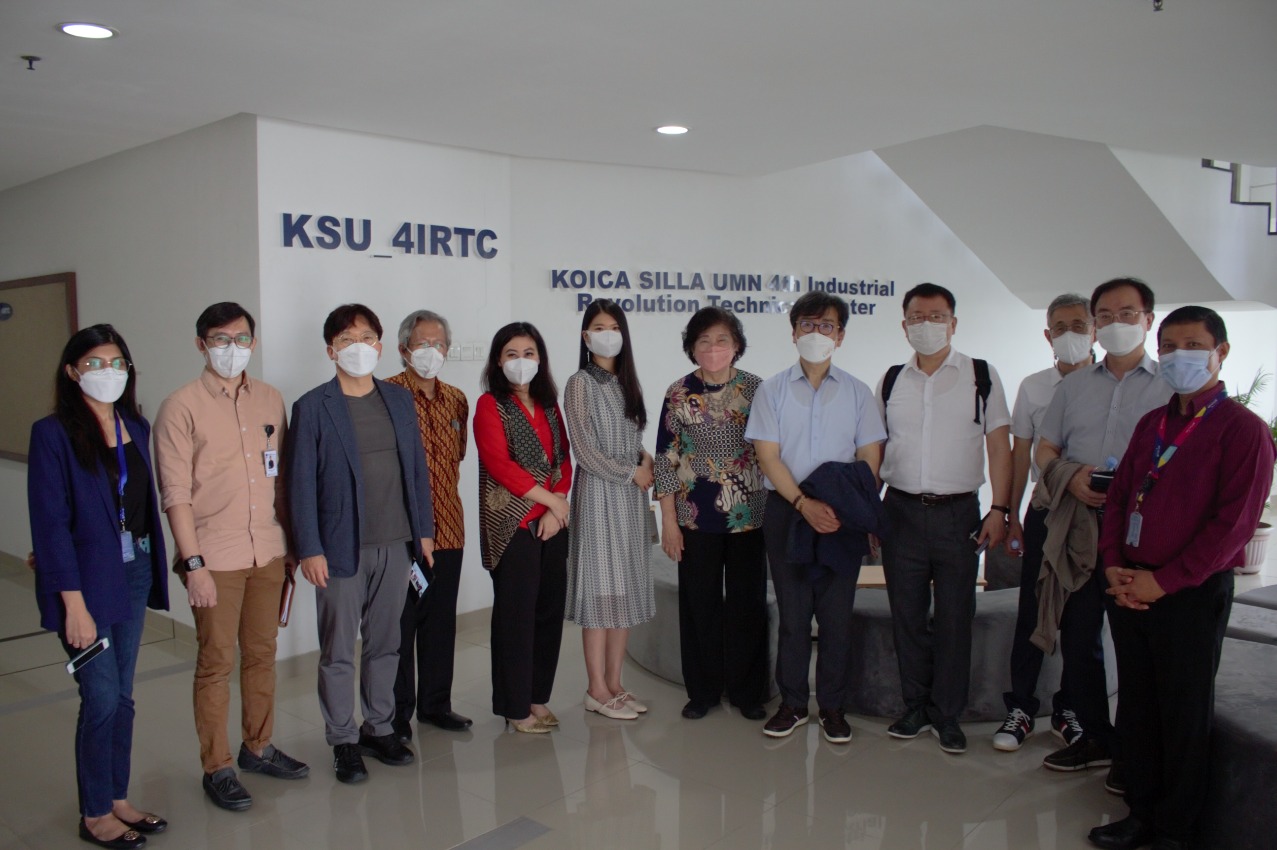
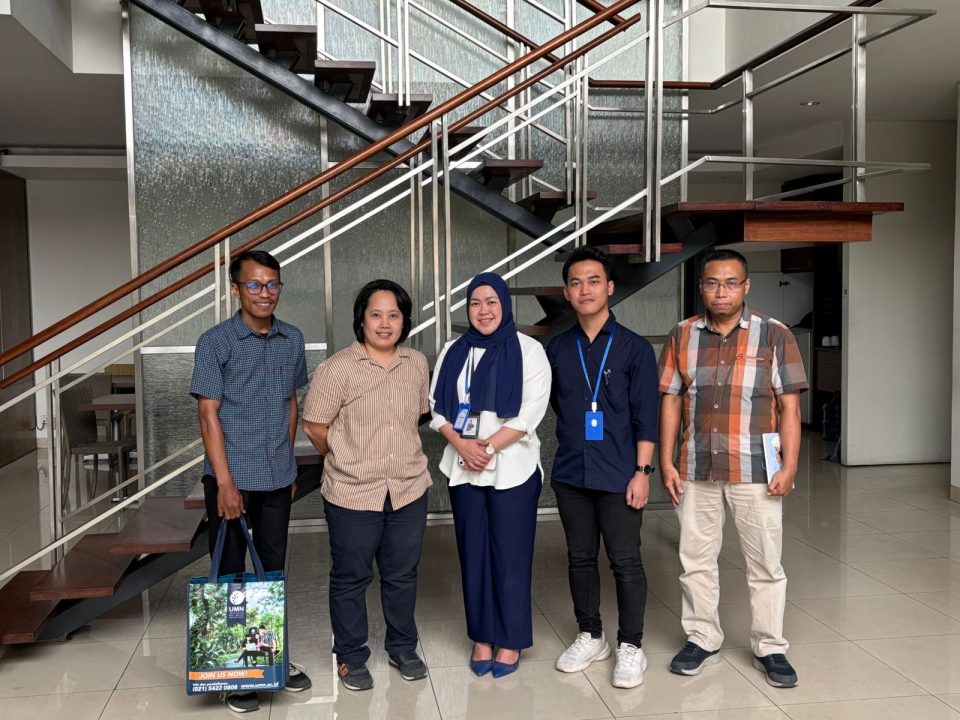
Representatives of Professors from KOICA and Silla University Came to UMN for a Monitoring and Evaluation Visit
April 21, 2022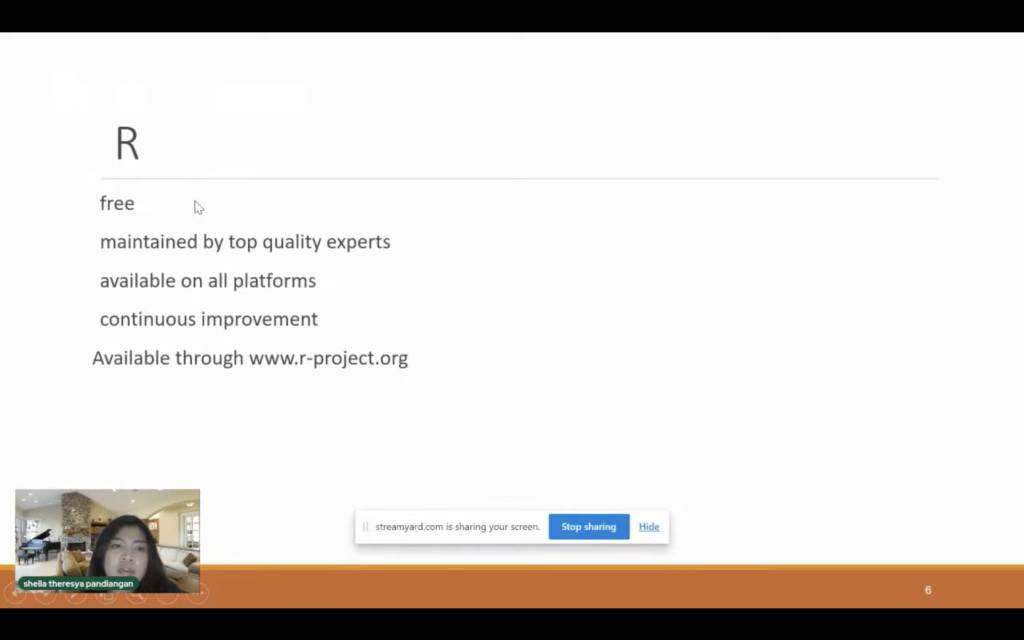 R Fundamental for Data Science (Doc. DQLab)
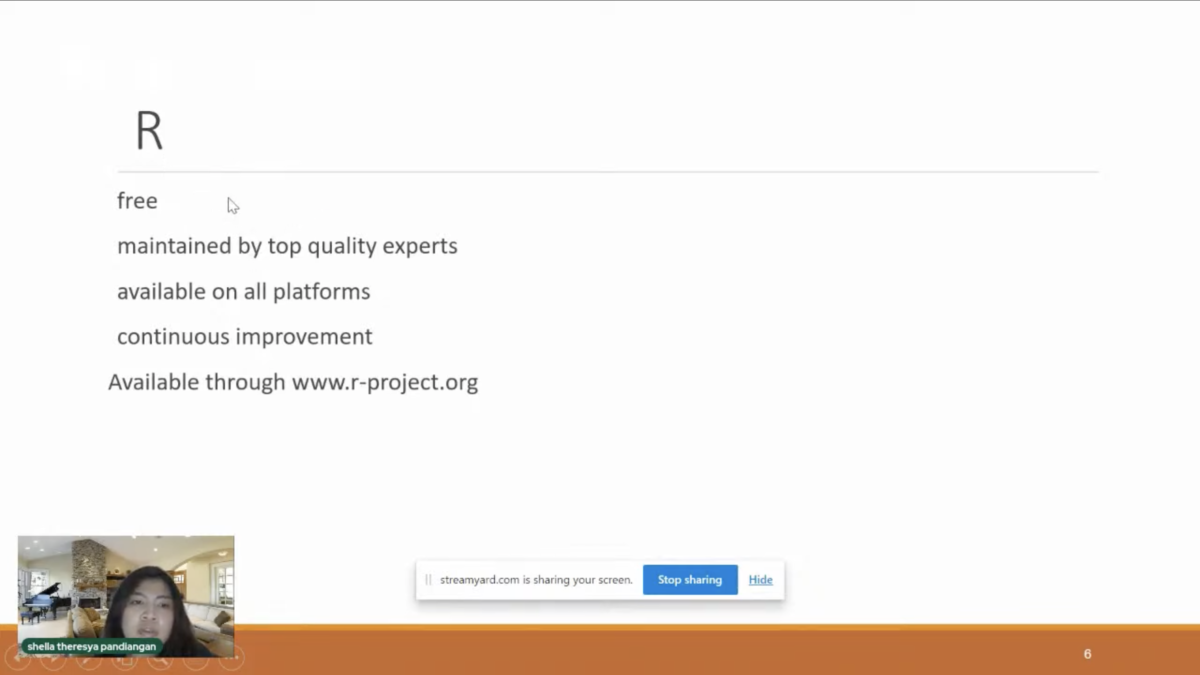
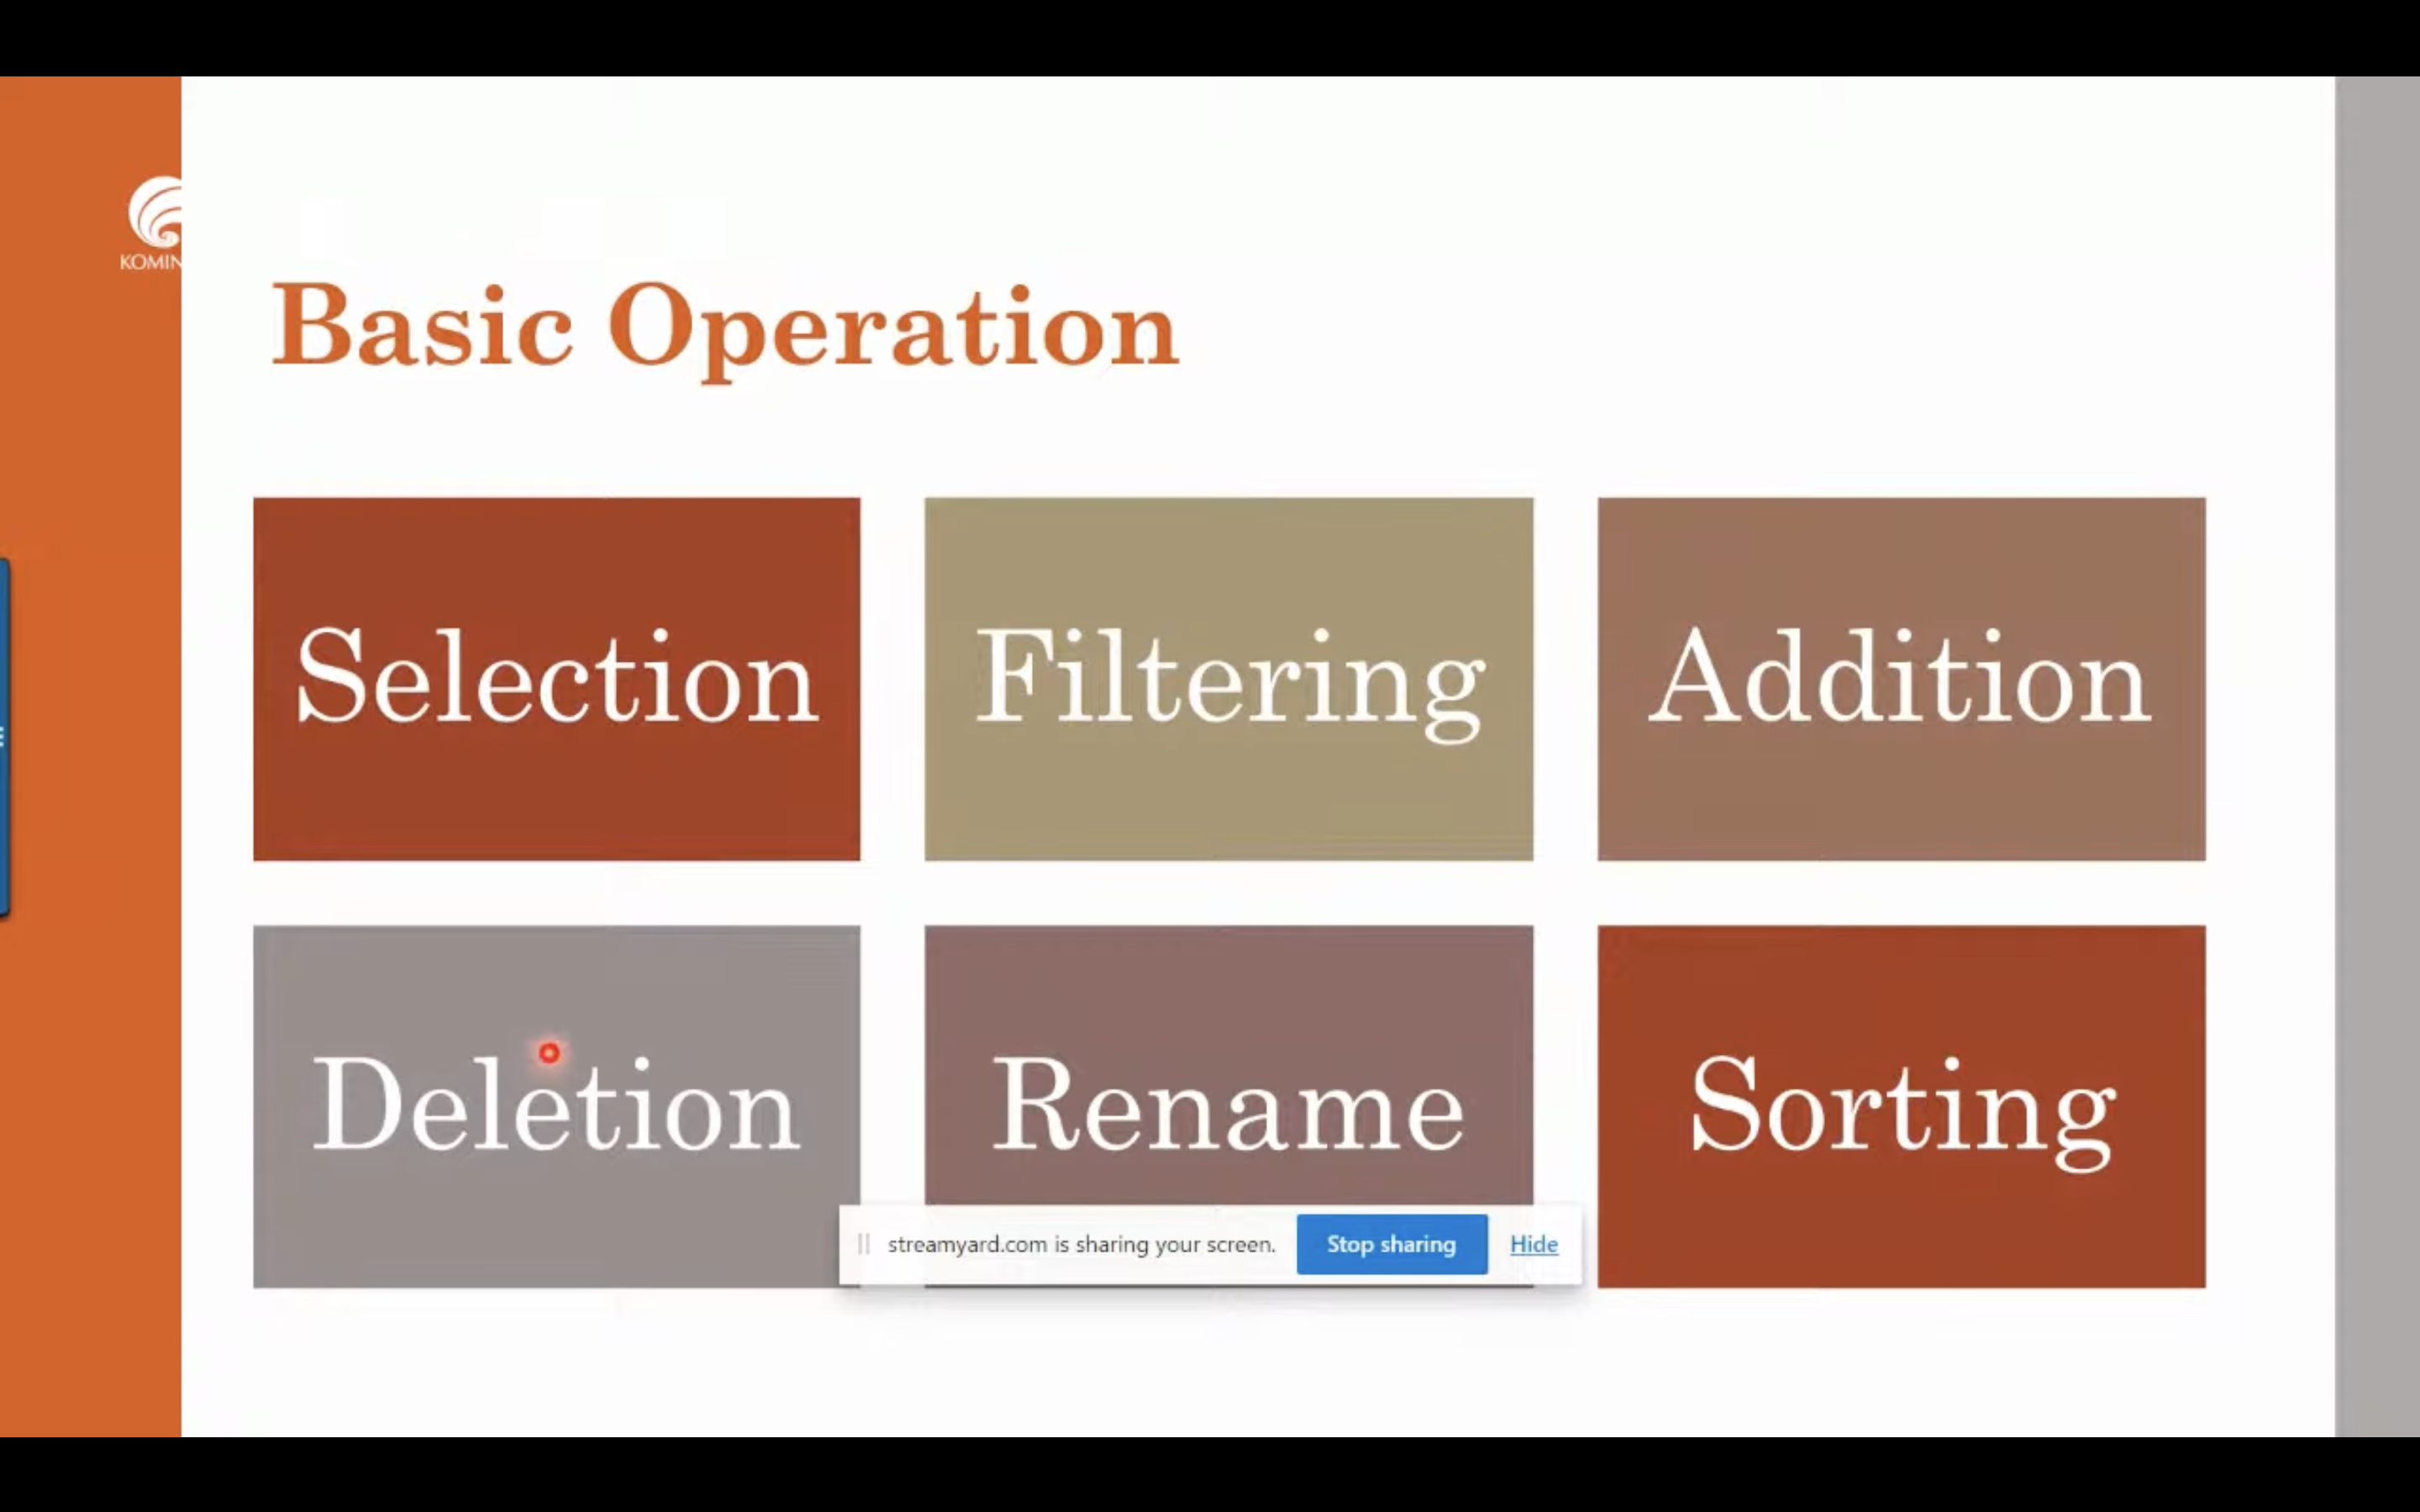
Tangerang – R is a programming language and software that focuses on data processing and graphics. R is one of the popular programming languages because it has many features. Therefore, DQLab, together with Kominfo, held a live session explaining R Fundamentals for Data Science. This session invited Shella Theresya Pandiangan, a Data Scientist at United Tractor, to present the materials. This live session was held online on Friday (11/03/22).
Shella started by explaining the differences between a data team that consists of Data Scientists, Data Engineers, and Data Analysts. According to Shella, the difference between the three is in the tasks. A Data Scientist is tasked with packing data to modeling and finding insights. The basic skills needed by Data Scientists are mathematics, programming (SQL, R, and Python), and communication. A Data Scientist must master data managers and statistics.
A data engineer is like a data architect or someone who builds data. A Data Engineer is in charge of tidying up the data warehouse, building the framework, and seeing the relationship between the first and second tables. The skills that data engineers must master are programming (Hadoop, MySQL, and Python), mathematics, and big data. A Data Engineer must be able to master database administration and data architecture.
A data Analyst is more in charge of visuals or short-term analysis used to build dashboards. What is needed in a Data Analyst is statistical skills, communication, business knowledge, and programming languages (Excel, Tableau, SQL, and R). It is superior if a Data Analyst can master business analysis too.
“Data practitioners in company A doesn’t necessarily have the same job as data practitioners in company B,” Shella said.
Also read Webinar DQLab x Shopee: Mengenal SQL pada Business Analytics untuk Mahasiswa
Shella continues to give a brief overview of the type of software statistics. There are three types: command-line software, GUI-based software, and hybrid types. The hybrid type is contained in R and is why R is used in today’s lesson. Some examples of statistical software are SAS, SPSS, Minitab, Statgraphics, S-Plus, and R.
Shela further explained that R is used in this lesson because R is free, has top quality, is available on all platforms, and contains future improvements.
The basics of statistics in R are summary, mean, stdev, t.test, and boxplot. In R, there are several packages. To choose a package, you can use Load Packages, such as qcc (quality control) or survival. In R, there are also several functions which are R commands that have and accept some text or number values as parameters.
In this session, Shella only introduces the basics. She will explain the details in the next session, namely Statistics with R.
R is an open-source that makes it easy for beginners or students to learn this programming language. As a foundation for starting a career in data, R is very important to understand. Start your career with DQLab.
*by Agnes Nurlisa | DQLab
Kuliah di Jakarta untuk jurusan program studi Informatika| Sistem Informasi | Teknik Komputer | Teknik Elektro | Teknik Fisika | Akuntansi | Manajemen| Komunikasi Strategis | Jurnalistik | Desain Komunikasi Visual | Film dan Animasi | Arsitektur | D3 Perhotelan | International Program, di Universitas Multimedia Nusantara. www.umn.ac.id
