Discussing Machine Learning and AI in the Future with UMN’s DQLab
October 31, 2024
UMN Officially Collaborates with The Buddha Tzu Chi Indonesia Foundation
October 31, 2024Tangerang – With the implementation of data-driven corporate culture in various fields in this digital era, understanding and visualising data is a superpower skill that can open exciting career doors! But wait a minute! Many beginners make the wrong move by immediately aiming for a cool position like a Data Scientist without understanding the basics.
Starting a career in any field is like climbing a mountain. We need to start from the bottom with the right steps so we don’t run out of steam halfway up. Well, Data Analyst is an ideal starting position, as it’s not just about compiling reports, but turning numbers into visual stories that help companies make big decisions.
To help beginners start this journey, DQLab held another Free Class Batch 50 titled “Introduction to Data World”. One of the presenters was Diardano Raihan, a Senior Data Analyst at Sekolah.mu, who, in his casual style, shared necessary knowledge and strategies, such as Top-Down and Bottom-Up approaches. In addition, Diar also invited participants to dive into the world of data visualization, a magical way to make data easy to understand and, of course, look cool!
Diar opened the class by explaining that a Data Analyst usually uses two main approaches in their daily work. The first is the Top-Down Approach, where in this approach, an analyst starts working from a specific problem or question given by a stakeholder.
“For example, management wants to know why there is a decline in sales in a particular month. From the available data, you have to present a report or model that helps them make strategic decisions,” explains Diar.
Second, the Bottom-Up Approach is the opposite approach. This approach is more exploratory and is often used when no specific problem is defined at the beginning.
“For example, friends are given raw data about motorcycle services and asked to find interesting patterns or insights. This requires curiosity and Exploratory Data Analysis (EDA) techniques,” he adds.
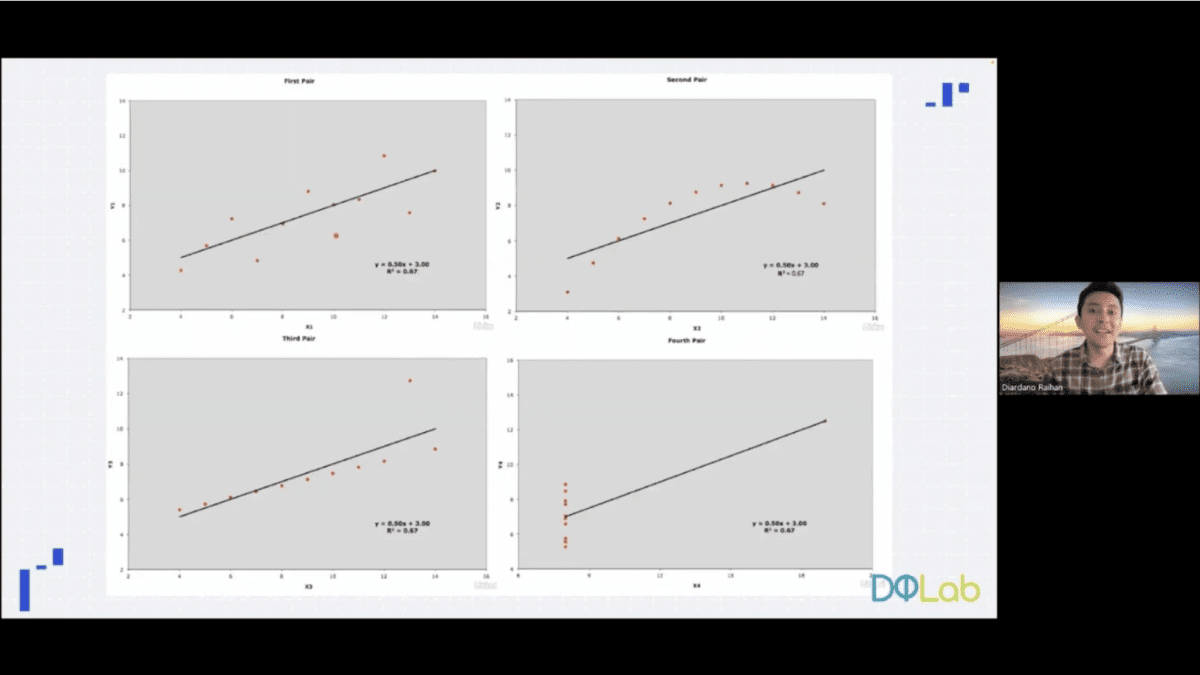
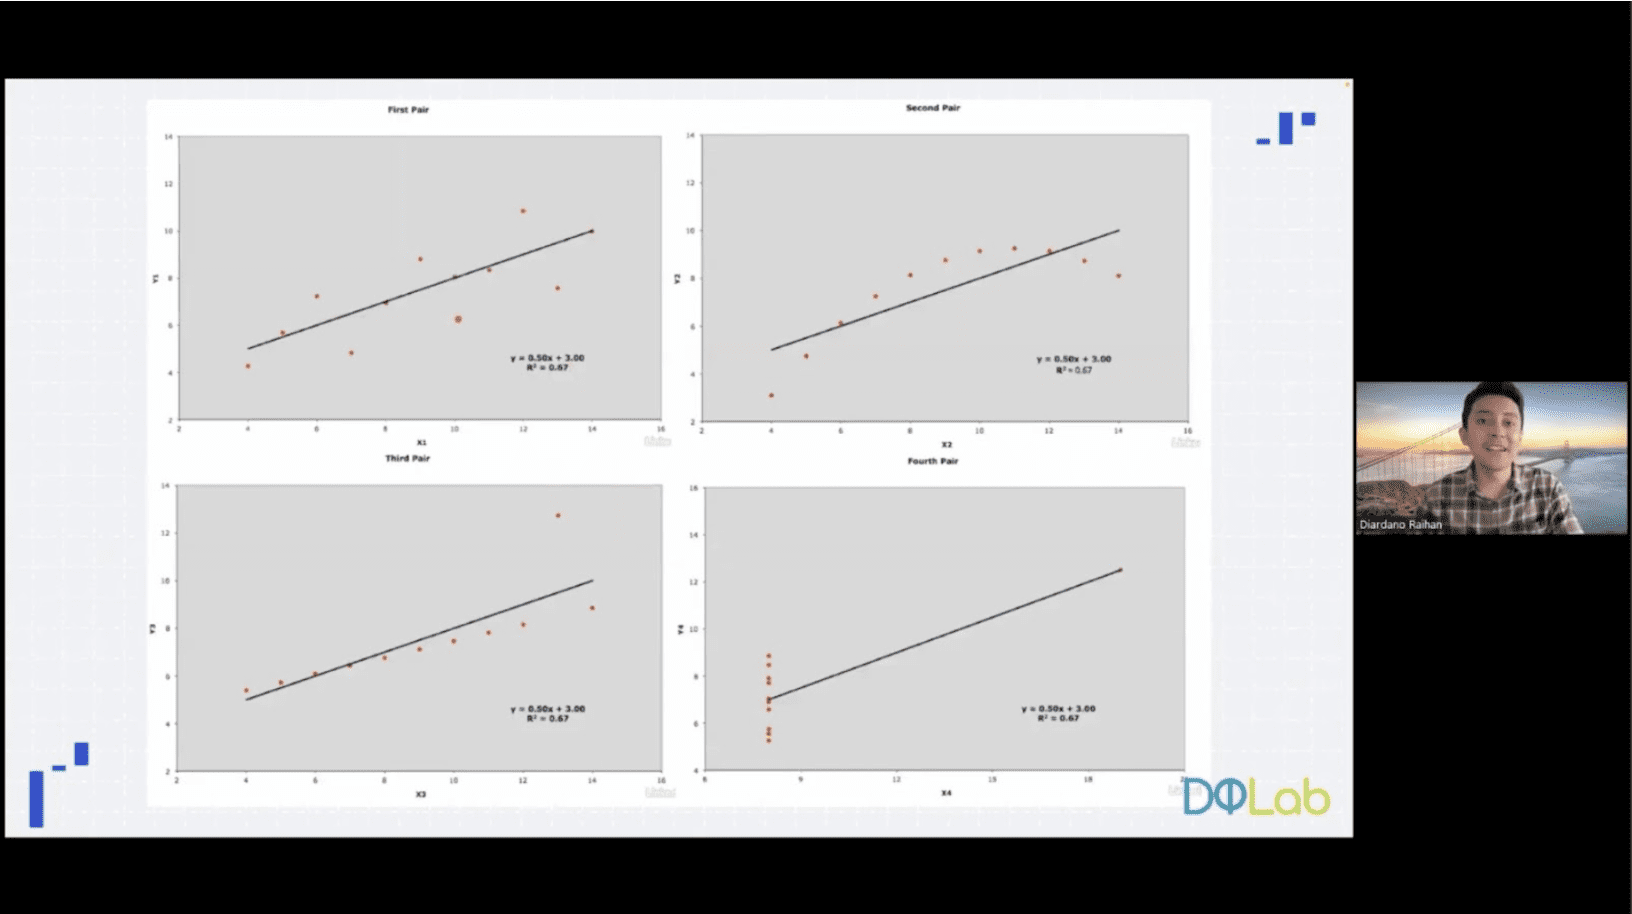
Both approaches are equally important and play a role in driving better decision-making in the company. In addition, Diar also emphasized that data visualization is key to simplifying complex information.
“Tabular data can be very difficult to understand quickly. However, with the right visualization, patterns and insights can be found more easily, such as outliers, trends, or anomalies,” Diar said.
He also gave recommendations for some visualization tools widely used by professional Data Analysts, such as Tableau and Looker Studio, which are used to facilitate the creation of interactive dashboards. Power BI, usually used for business analysis and operational reporting. Metabase and Streamlit, used to help present data visually in lightweight applications. Finally, Until Dash by Plotly, which is used to create Python-based interactive data applications.
A Data Analyst can compile informative and interesting reports by utilising these tools. For example, sales trends or customer satisfaction visualized in the form of bar charts or heatmaps will be much easier to understand than simply displaying raw data or visualizations in the form of pie charts. According to Diar, the human eye tends to have difficulty distinguishing and reading the amount of angles in a circle.
In addition to discussing technicalities, Diar explained the career prospects and salaries in the data field. Entry-level Data Analysts can earn salaries starting from 8 million Rupiahs per month, while senior positions can reach 30 million Rupiah. Career flexibility is also an advantage in this industry. With the right skills, we can switch roles between Data Analyst, Data Engineer, and Data Scientist.
Diar suggests that beginners strengthen their personal branding by creating a project portfolio on platforms such as LinkedIn, GitHub, or Kaggle. This portfolio can show our ability to process and visualize data.
Therefore, Diar recommends that DQLab’s Data Analyst Bootcamp is the right choice for beginners who want to deepen their skills. The program offers HERO (Hands-On, Experiential Learning, & Outcome-Based) based learning designed to be beginner-friendly. With a curriculum relevant to industry needs, complete modules, and 24-hour AI Chatbot assistance, participants will get the best learning experience.
Last but not least, DQLab has also been proven to produce excellent talents with successful careers in the data field. So, what are you waiting for? Prepare yourself for a career in data by signing up or joining Data Analyst Bootcamp with SQL and Python right now!
By Lisya Zuliasyari | DQLab
English translation by Levina Chrestella Theodora
Kuliah di Jakarta untuk jurusan program studi Informatika | Sistem Informasi | Teknik Komputer | Teknik Elektro | Teknik Fisika | Akuntansi | Manajemen | Komunikasi Strategis | Jurnalistik | Desain Komunikasi Visual | Film dan Animasi | Arsitektur | D3 Perhotelan , di Universitas Multimedia Nusantara. www.umn.ac.id

